
Overview of Your
Global Manufacturing
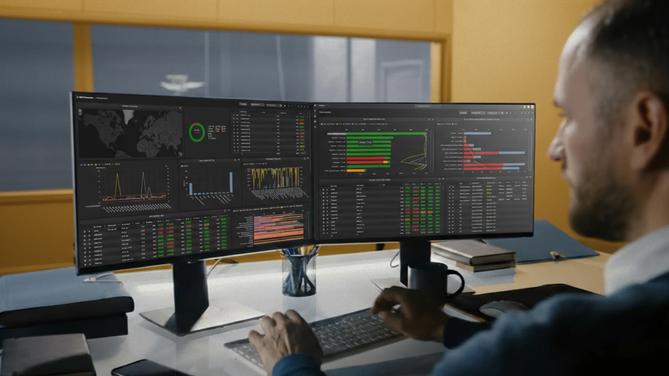
Effective Dashboards can have a significant impact on Manufacturing Performance. WATS lets you create real-time dashboards that go beyond generic BI - built specifically for electronics manufacturing.
Compare and Measure KPIs in Real-Time
The WATS dashboards module lets you compose your own views that display real-time performance. Public, shared or private Dashboards. Your choice.
Build dashboards your way
Use any combination of visual elements, charts and grids, from different WATS reports to create one view. For displays on big screen or for easy access to custom combinations of report elements.
Track and compare what matters
Track important Key Performance Indicators for electronics manufacturing on a global Enterprise level or compare performance between production lines.
Stay ahead with real-time data
Spot trends as they happen and be instantly informed of potential severe trends in your production. WATS dashboards help you act fast, not after the fact.

Stay Connected to Every Test Station
WATS Dashboards supports a Global Station Map widget, showing your virtual levels, as well as volume and yield in a world map.
See it all, instantly
Visualize your global test network on a real-time world map. Track where your test stations are and how they’re performing — all in one place.
Live system health indicators
The Station map uses GPS coordinates to automatically plot the servers and levels on the map, which additionally gives you a graphical indication of their current health status and the number of UUT/UUR reports transferred or received.
Flexible and integrated
Use the Global Station Map as a built-in dashboard or as a widget in your own setup. Always up to date. Always in sync.

Everything you need to know
about WATS Dashboards
Explore more videos
How to get an overview of your global manufacturing
A short introduction on how to get an overview of your production using both WATS Dashboards and WATS Process Heatmap.
Build the view you need with WATS Dashboards
A short, but yet comprehensive, video on what you can visualize with dashboards and how easy you can set up your own dashboards.
Webinar Dashboard & WATS Mobile App
Recorded version of our in-depth walk-through of WATS Dashboards. All you need to know to build, configure and share dashboards.Learn More About WATS Product Features
Test Data Analytics

Test step analysis provides powerful tools to analyze your specific test steps of one or more sequences. Analyze your test steps in depth and find roo...
Root Cause Analysis with AI

The WATS Process Heatmap turns complex data into intuitive, actionable insights. Drill down from high-level insights to the exact test steps causing t...